Working with Time Series
Last week we were working with billboard data that we wanted to convert to time series. This week we are going to work through how to make that happen.
Working with time series means we are going to need to import datetime. We also need to come up with a range of time for which this data set covers. This means we need to find the earliest date of the earliest data point, and then the latest date of the latest data point and create a timeseries of weeks for the period between those two dates.
import datetime as datetime
# Converting the date_entered of our data set to datetime data.
start_dates = pd.to_datetime(df['date_entered'])
# Now we are finding the earliest date, or the minimum start date. This is the earliest date that we have data for
first_date = min(start_dates)
last_date = max(start_dates)
# Creating a list of dates split into weeks from the earliest a song entered the charts until the last time
date_list = pd.date_range(start=first_date,end=last_date, freq='W')
Now that we have a list of dates split into weeks over the appropriate range we can create a dataframe with time_series as the index and we will use the songs as the columns. We are going to put the placement of a given song during each week in the respective column. If the track was not on the chart for a week we will put a ‘None’ value instead.
# Initializing new data frame
df_time = pd.DataFrame(columns = df.track, index = date_list)
df_time.index.name = 'Date'

# Transposing data so we can iterate over songs
df_t = df.transpose()
for t in df_t:
    curr_song = df_t[t]
    track = df_weeks[curr_song.track]
    if isinstance(track, type(df)):
        track = track.iloc[:,0]
    # Creating a temp list
    temp = []
    i = 1
    for d in df_time.index:
        # If track has not entered the charts yet, put None
        if d < pd.to_datetime(curr_song.date_entered):
            temp.append(None)
        # Else if find the value for this songs position on the chart for this week in it's run
        # We are counting with i to avoid indexing issues
        elif i < len(df_weeks):
            temp.append(track.iloc[i])
            i+=1
        # Else append None when the songs run is over anyway. This will only hit for songs that entered the chart early
        else:
            temp.append(None)
    # Update our new data frame with our time_series organized data
    df_time[df_t[t].track] = temp
With our now time series indexed data frame plotting with time as our x axis should be super easy!
df_time[top_5.track].plot(style='-')
ax = plt.gca()
plt.ylim(1,100)
ax.set_ylim(ax.get_ylim()[::-1])
ax.set_yticks([1,20,40,60,80,100])
plt.ylabel("Position on Billboard Hot 100")
plt.legend()
fig = plt.gcf()
fig.set_size_inches(10, 6)
fig.savefig('run_by_time.png', dpi=100)
plt.show()
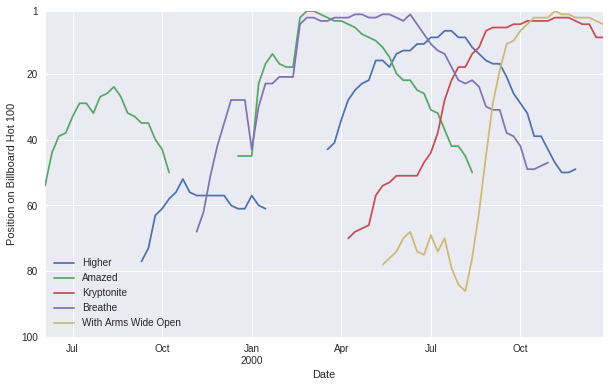
There we have it. The same plot as before, but now with a time series axis. I was going to try to impute the missing data for this dataset, but I will leave that as a project for another time.